
Employment Projections
Projected Total Employment

Employment Level
Average Annual Change
Numeric
%
Percentage
By Industry Sector
July 2019

Employment Level
Average Annual Change
Numeric
%
Percentage

Fastest Growing Occupational Groups
()
()
Occupational Group
Average
Annual
Change
Annual
Change
Annual
Percentage
Change
Percentage
Change
|
|
%
|
|
|
|
% |
|
% | ||
% | ||
% |
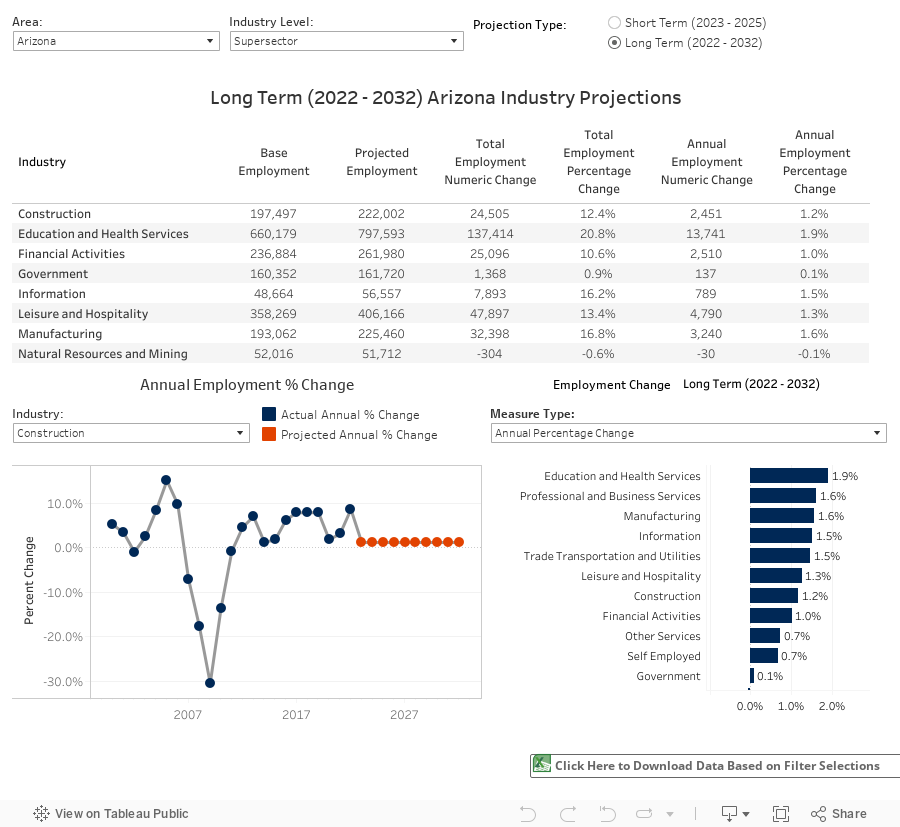
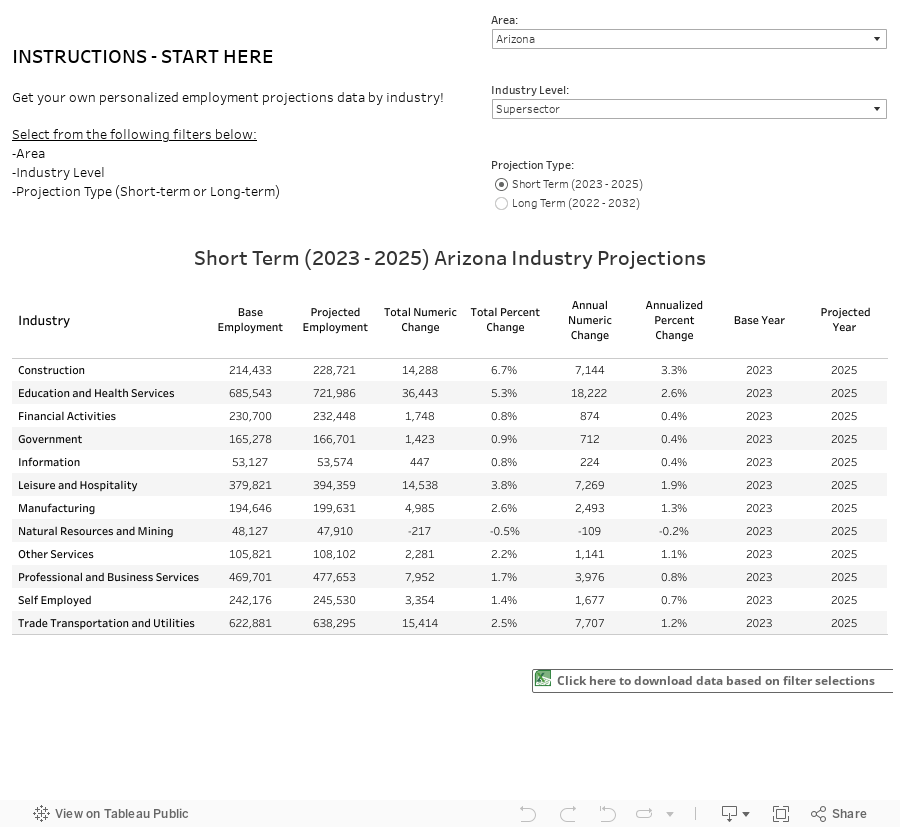
Industry projections
Employment Projections Trends
Data Description
The industry employment projections estimate future employment changes for educational and economic planning purposes. Estimates are available for Arizona and local workforce areas by detailed industry categories.
Employment Projections Custom Data Search
Download the data
Employment projections data tables
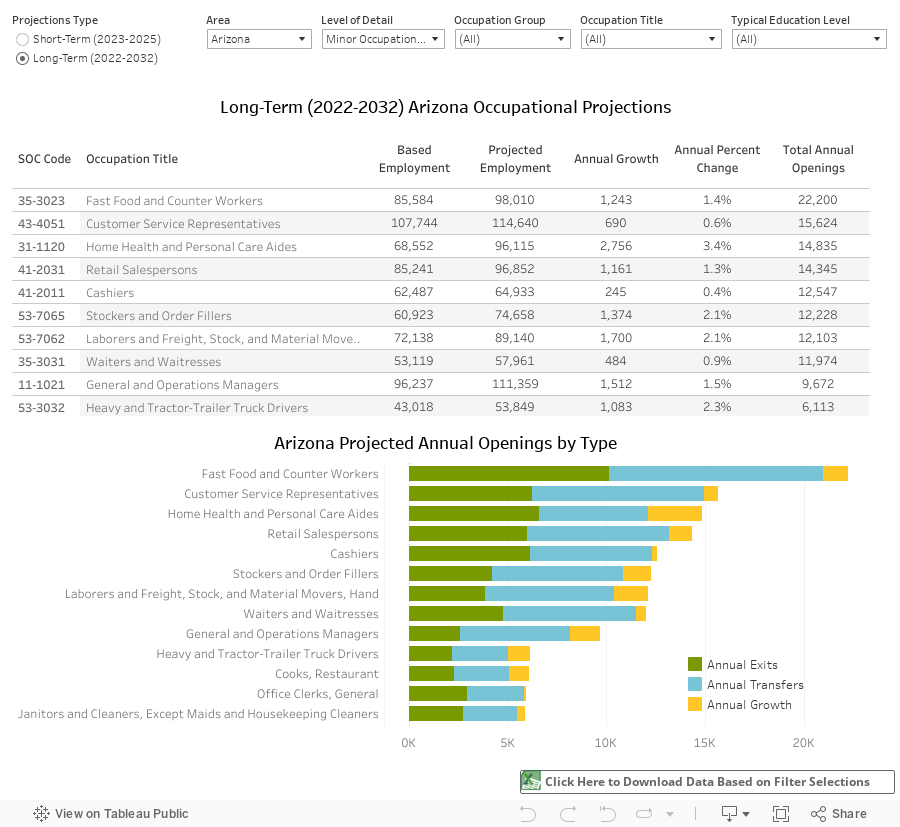
Occupation projections
Occupation Projection Trends
Download the data
Employment projections data tables